Examining the Impact of Various Factors on SaaS Valuation (Geography, Profitability, ARR Growth, AI/ML, etc.)
What's driving SaaS returns? Are there differences in valuation between U.S. and European SaaS companies? Are SaaS private markets at higher or lower valuations than the public market? Let's find out.

In July, I discovered an insightful slide deck by Avenir Capital that highlighted several intriguing statistics about the SaaS (Software-as-a-Service) landscape. Inspired by this deck, I decided to conduct some of my own research on the industry.
Using market data from S&P Capital IQ, I analyzed software companies with market caps exceeding $1 billion across Canada, the U.S., and Europe. This paper aims to identify trends driving SaaS returns and examine the differences between global SaaS markets.
Summary Points (TLDR)
In this paper, I explore key industry trends and investment opportunities within the global SaaS markets, focusing on:
Public and private SaaS valuations, highlighting notable discrepancies between them.
The differences in valuations between small and large SaaS deals, and how growth equity firms are capitalizing on these opportunities.
EBIT profitability as a potential factor influencing SaaS valuations and its broader impact across U.S. SaaS companies.
Revenue growth as the primary driver of SaaS valuations, and why some regions are not receiving multiples that align with their revenue growth rates.
Opportunities for private equity firms to leverage re-shoring strategies.
The role of AI in boosting valuations for public SaaS companies.
The importance for SaaS companies to leverage AI to build and protect their competitive moats, rather than allowing AI to erode them.
Today’s Valuations
Average SaaS valuations differ across global markets, which is why I chose to break down the industry geographically.
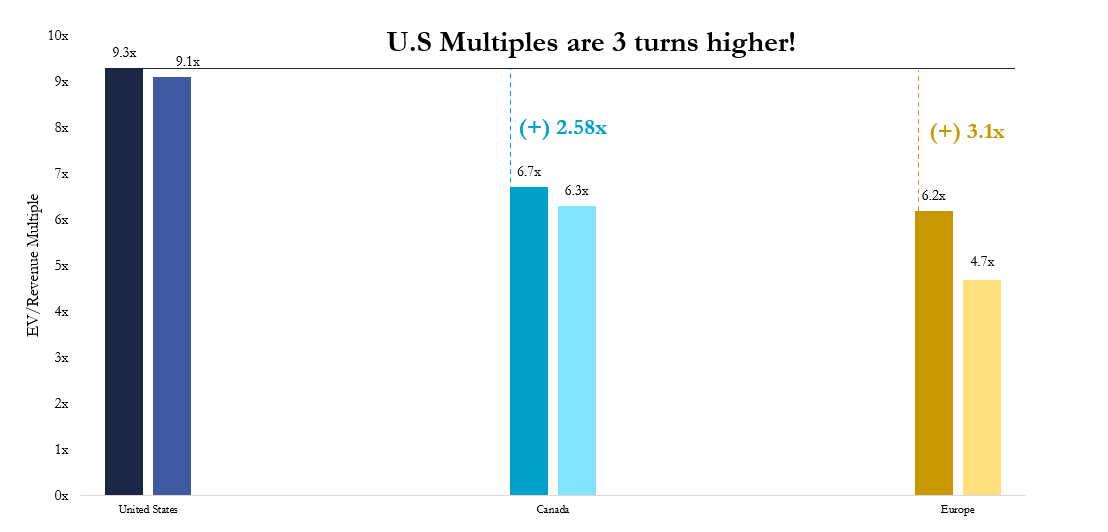
(The darker-colored bars for each country = the mean multiple. Lighter-colored bars = the median multiple.)
U.S. SaaS multiples are notably higher than those of Canadian and European SaaS companies, with a mean multiple of 9.3x compared to 6.7x for Canada and 6.2x for Europe.
This discrepancy is largely due to the stronger growth potential and market dominance of U.S. SaaS firms, who benefit from a larger domestic market, higher levels of investment, and a more mature tech ecosystem. Additionally, the U.S. GDP grows faster than that of Europe or Canada.
These differences present potential arbitrage opportunities through re-shoring for SaaS-focused private equity firms. While achieving this is easier said than done, improving the valuation of these companies could lead to higher returns.
Today’s Valuations: Private Transactions
In the private markets, recent transaction data from the past three years reveals that average transaction multiples for SaaS companies align closely with public market valuations.
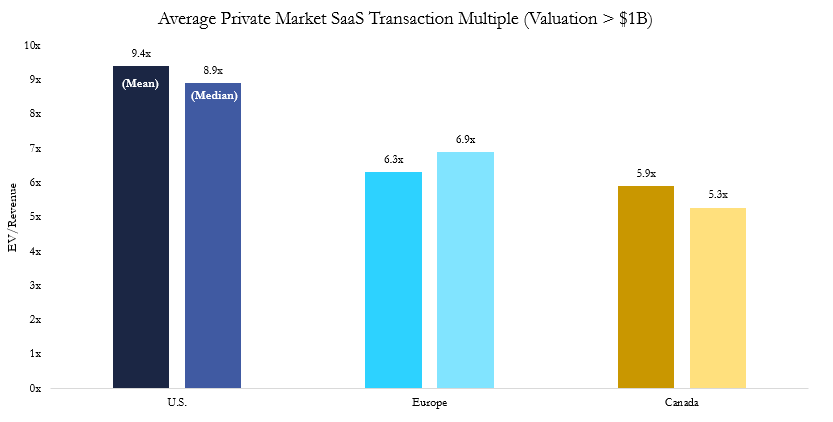
Over this period, multiples in M&A activities have closely tracked those in the public markets. During 2021 and 2022, U.S. private equity funds amassed unprecedented levels of capital, leading to intense competition for deals and driving valuations to record highs. This surge in capital deployment created a seller's market, where demand for high-quality SaaS assets outstripped supply, pushing deal multiples to levels comparable with or even higher than public market valuations.
Investable Opportunity: What’s going on with Canada?
Interestingly, the mean and median for Canadian SaaS in the private markets are both greater than the median multiple for public Canadian SaaS companies today. If the Canadian public is more skeptical about the future of SaaS than private equity investors, then a take private represents a potential arbitrage opportunity.
Today’s Valuations: Smaller SaaS Deals
I also examined valuations for deals ranging between $10 million and $1 billion. For smaller SaaS companies, valuations were significantly lower (by around 2.6 turns of revenue) in the U.S., but very comparable for Canadian and European unicorns.
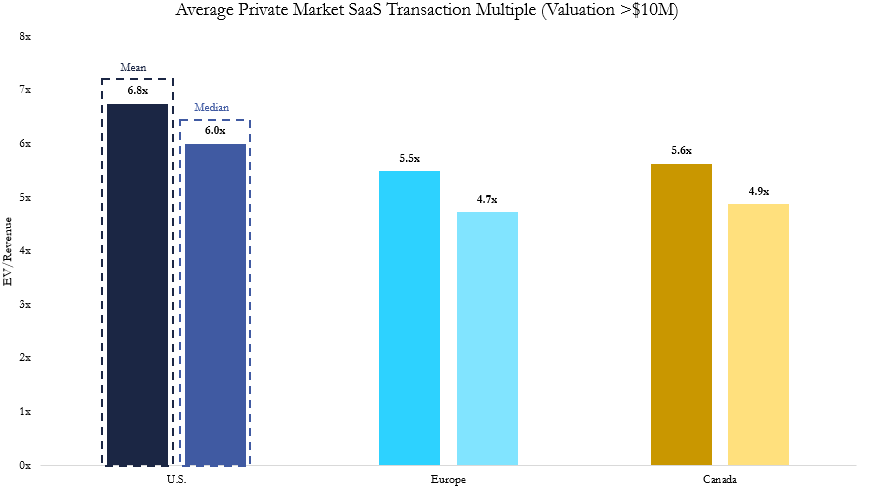
This was surprising, as I expected all three regions to have lower valuations for smaller companies due to the higher risk associated with a less established company. However, the U.S. was the only region where multiples compressed.
I suspect this reflects the amount of investment directed toward SaaS in the U.S compared to the actual returns generated. Not every investment resulted in a unicorn, leading some companies to offload investments at lower multiples.
Investable Opportunity: Is it a good time to be a U.S. growth equity company?
The difference in average valuations between companies with market caps above $1 billion and those between $10 million and $1 billion indicates that growth equity firms making $10 million to $100 million investments in U.S SaaS companies could see substantial returns by scaling these smaller companies.
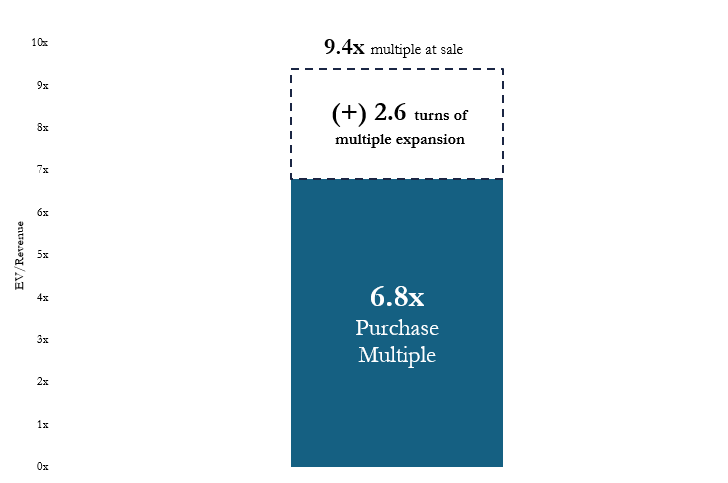
When it comes time to exit these investments, growth equity firms could potentially benefit from significant multiple expansions as the companies grow in size and valuation.
Scale isn’t the only driver of valuation of SaaS, however. So let’s learn about what is driving SaaS mechanically, through the public markets.
So, what’s driving valuation in SaaS today?
Valuation Driver: EBIT Profitability?
Initially, I considered whether profitability growth was a primary driver of SaaS valuations. In today's macroeconomic environment, high capital costs are depressing valuations and making equity investors more cautious. Consequently, software companies must demonstrate near to medium-term profitability, as the days of excessive cash burn are over.
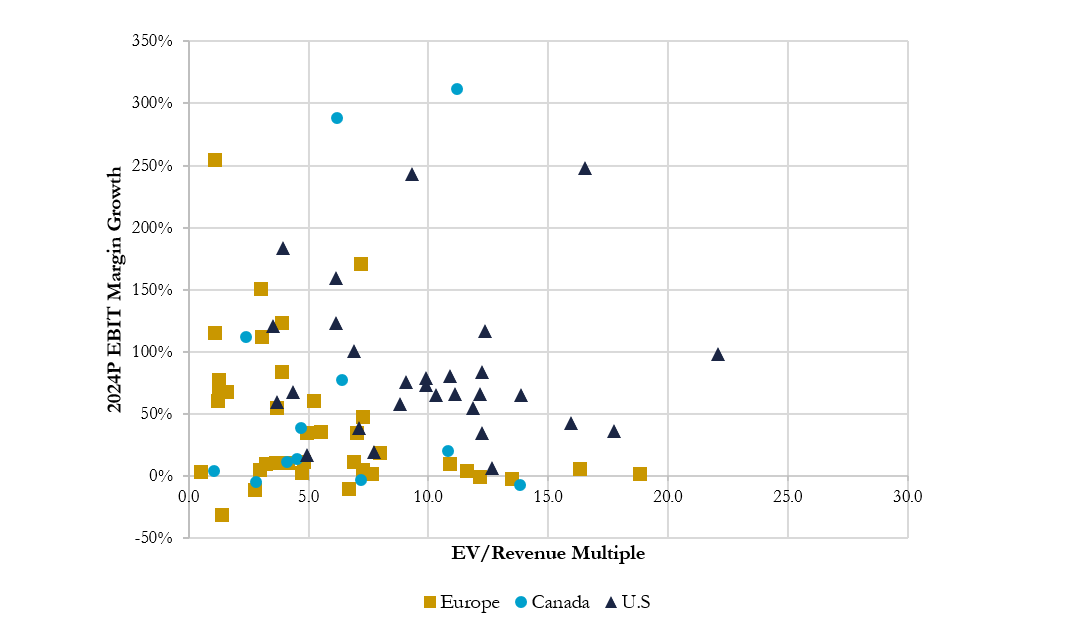
(Many U.S companies are not shown on this graph because they will turn profitable in 2024, so calculation is not possible)
The data shows little to no correlation between profitability and SaaS valuations. Investors aren't necessarily rewarding firms for pivoting toward profitability.
However, the lack of a valuation premium does not mean SaaS companies aren't becoming more profitable. Over 30 SaaS companies are projected to grow their EBIT margins by 50% or more in 2024, indicating a strategic shift by SaaS management towards greater operational efficiency in response to the economic climate.
Industry Trend: New Companies Finding EBIT Profitability
Furthermore, many SaaS companies will realize their first operating profits in the near term.
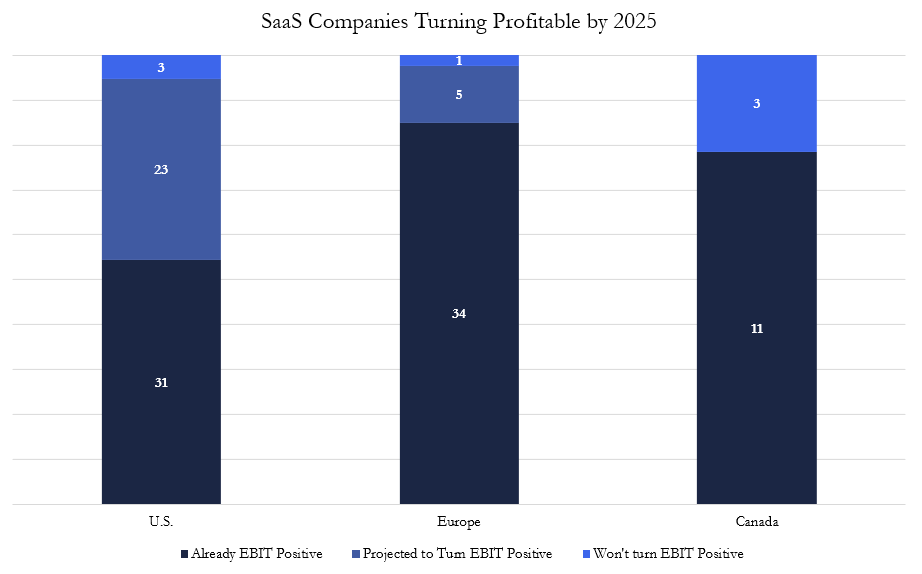
From 2023 to 2025, 23 out of 57 U.S. SaaS companies with market caps over $5 billion (about 40%) are projected to turn EBIT positive.
This trend contrasts with Europe and Canada, where fewer public SaaS companies are unprofitable. European and Canadian firms often wait to become profitable before going public, while U.S. companies are more likely to IPO based on rapid revenue growth—even if they aren't yet profitable. This difference is partly due to the extensive investment landscape in the U.S., encouraging a focus on revenue growth (soon to be revealed) and market share over immediate profitability.
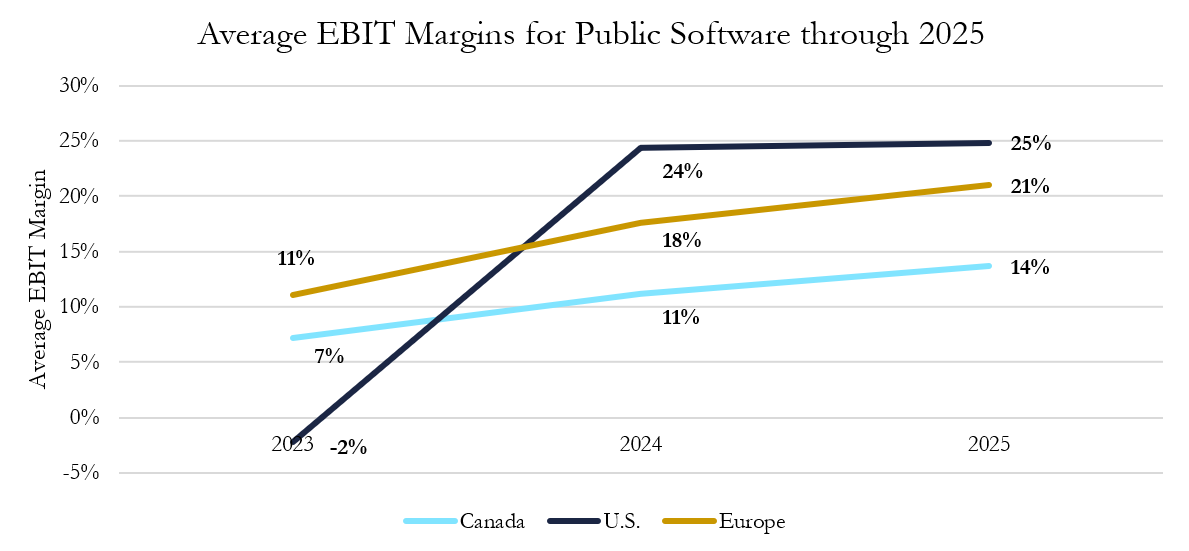
Additionally, the chart above shows that software companies, on average, expect to double their EBIT margins by 2025, highlighting a focus on profitability and signaling that U.S. firms anticipate near-term profitability.
Valuation Driver: Revenue Growth
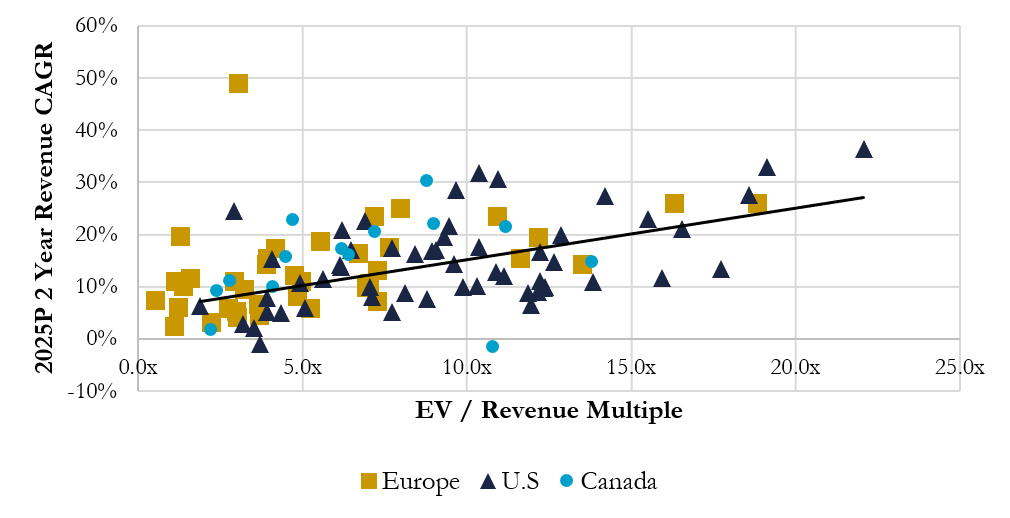
(Credit to Avenir for observing this first)
A regression analysis correlating EV/Revenue multiples of SaaS companies with their consensus 2-year revenue CAGRs reveals a positive association, with an R-value of 0.5315. It appears that revenue growth is a key driver of SaaS valuations globally. Companies aiming to boost their stock prices may need to prioritize new ARR growth initially to be rewarded higher multiples. This was surprising to me that even in interest rate environments of >5%, U.S. investors still prefer to see raw top-line growth instead of cash returns to shareholders.
A significant reason for this preference might be that many investors in public SaaS companies anticipate a similar trajectory to that of mature tech giants like Microsoft, Apple, and Google. These companies have reached a stage where they consistently return cash to shareholders through dividends and substantial share buyback programs. However, unlike these established firms, SaaS companies are often seen as in a growth phase, where investors prioritize revenue expansion over immediate returns. This expectation suggests that even in an environment with interest rates above 5%, U.S. investors are more focused on the potential for long-term growth and the eventual evolution of these companies into cash-returning entities.
Investable Opportunity: North American Re-shoring
Earlier, I highlighted that valuation multiples for U.S. SaaS companies are roughly 2.5 times higher than those of their Canadian counterparts. Now that we have established that net new revenue growth is a key driver of SaaS returns, we can examine the projected revenue growth rates for public SaaS companies in each region.
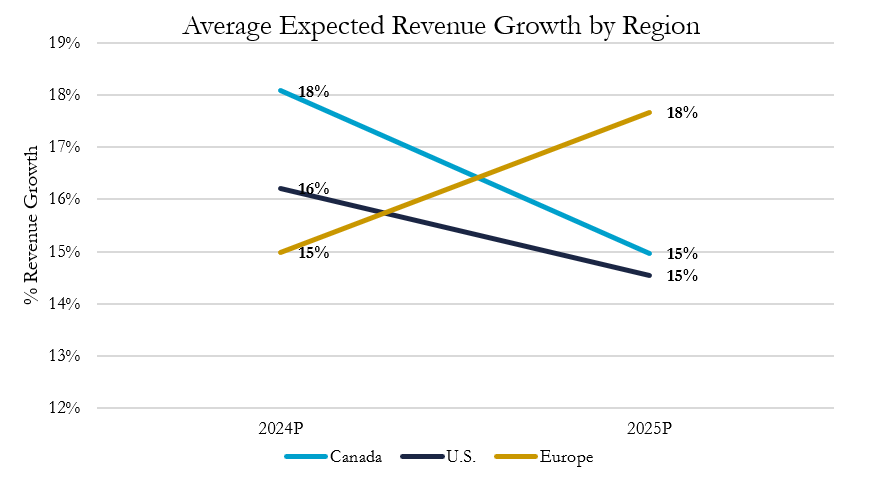
Interestingly, public Canadian SaaS companies are expected to grow faster on average than their U.S. peers. Additionally, the average European SaaS company is projected to grow nearly 18% in 2025.
If Canadian SaaS companies are indeed expected to achieve similar or even higher growth rates than U.S. companies, this could present a compelling investment opportunity for private equity firms. By bringing Canadian SaaS firms to the U.S. market, these firms could potentially achieve higher valuations.
However, this strategy isn't without its challenges. The U.S. SaaS market is already highly saturated, with far more companies than in Canada, which might mean there is more untapped growth potential within the Canadian market itself.
Valuation Driver: AI Adoption
I also explored the impact of AI adoption within each software company. By reviewing the most recent earnings transcripts of public Canadian and American companies (European ones were less accessible due to translation issues), I noted the frequency of the term "AI" mentioned per call. This analysis produced the following graph.
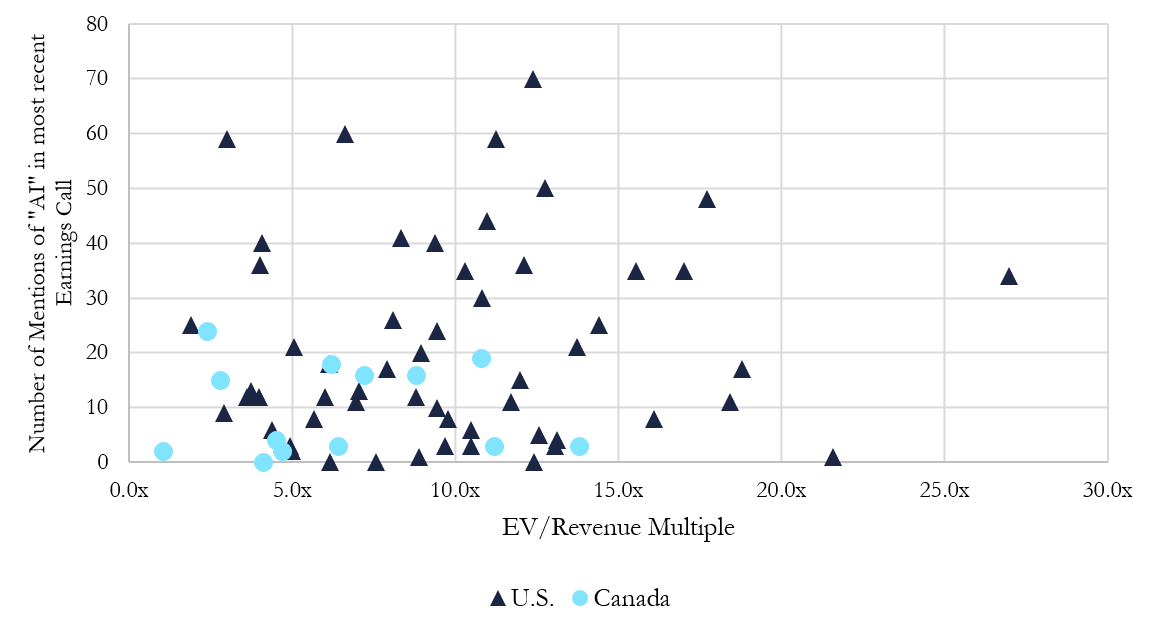
The generated graph does not indicate any significant correlation (R = 0.08). However, I also examined sentiment on each one of the earnings call. In specific, I noted if management teams were either launching new AI products or focusing future products on AI/ML. That’s when patterns began to emerge.
Among the 56 U.S. companies I had transcripts from, 43 (77%) were focused on AI and AI-related products, while only 13 mentioned AI sparingly. In contrast, out of 13 Canadian companies, 7 were actively working on integrating AI into their products, while 6 were not.
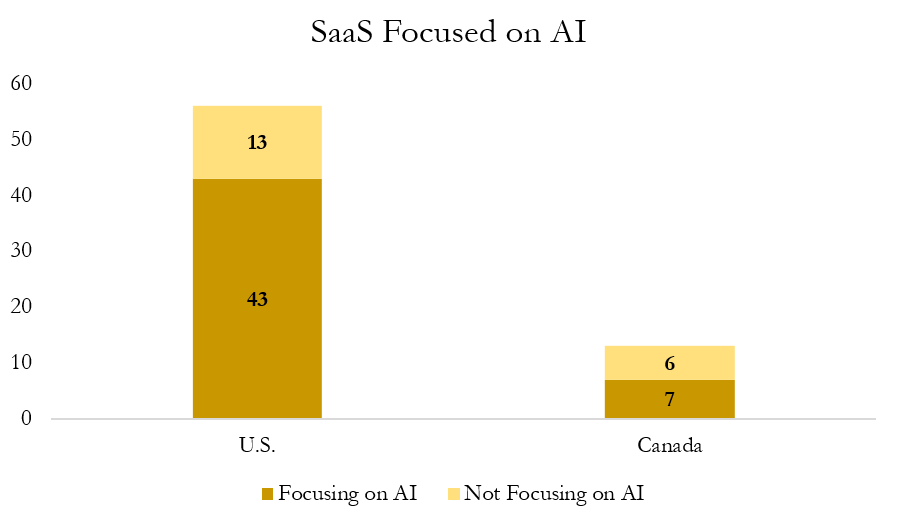
The graph indicates that U.S. companies are more focused on AI than their Canadian counterparts. This can be further highlighted by the average number of times AI was mentioned during earnings calls:
U.S. companies mentioned the term “AI” an average of 21 times per call, compared to just 9.5 times on average for Canadian SaaS companies—more than double the frequency.
Industry Trend: The AI Valuation Gap
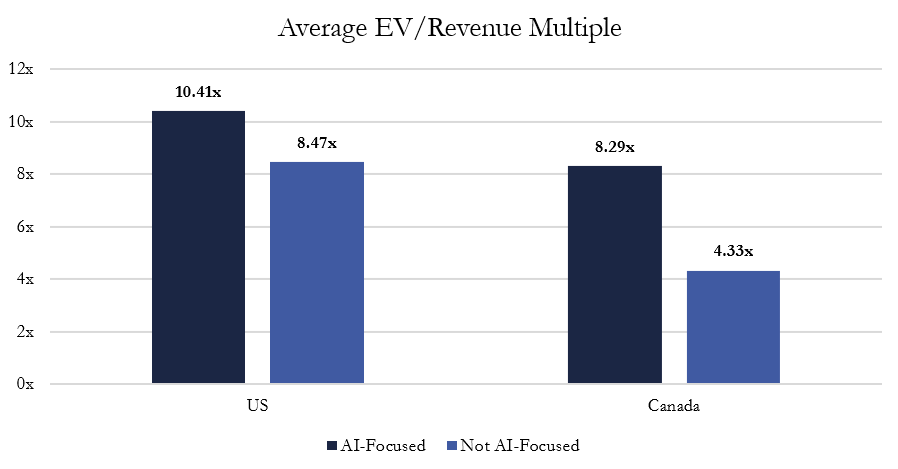
Here’s what’s particularly interesting: the average EV/Revenue multiple for AI-focused companies in Canada was 8.29x, whereas non-AI companies had an average multiple of 4.33x. In the U.S., AI-focused companies had an average EV/Revenue multiple of 10.41x, compared to 8.47x for those not focused on AI.
This suggests that companies emphasizing AI are achieving higher valuations. However, the difference between these two multiples was not statistically significant with a p-value of 0.064 (almost!). Thus, it is important to recognize that numerous other factors could be influencing this valuation such as overall company performance at earnings dates. Nonetheless, the data indicates a notable trend where AI emphasis could be linked to increased investor confidence and, consequently, higher valuations.
Industry Trend: AI Eroding Moats
With the rise of generative AI and large language models, some SaaS companies risk being sidelined by investors if deemed "GPT-able"—meaning AI capabilities could erode competitive moats before companies can integrate them themselves.
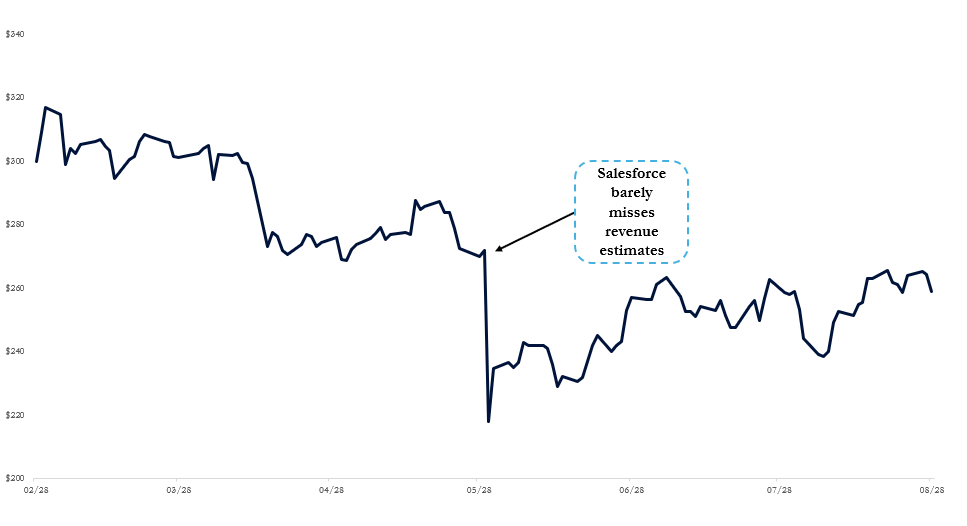
This concern is illustrated by Salesforce's CRM 0.00%↑ significant share price drop in late May.
Despite missing estimates, investors reacted strongly by selling off Salesforce shares, driving a 15% drop in a single day.
The reasons extend beyond sales figures, reflecting concerns about Salesforce's moat and AI strategy. David Friedberg, CEO of Ohalo Therapeutics and co-host of the All-In Podcast, commented:
“Why do I have to pay Salesforce a bunch of money when I can use some open source third party tool or some more freely available tool?”1
As large language models advance, they provide software developers with the tools to build applications that were once far more time-consuming and complex to develop. This shift makes it crucial for public SaaS companies to leverage generative AI to strengthen their competitive moats rather than risk having their own advantages eroded. By proactively integrating genAI into their offerings, these companies can enhance their market position and fend off potential threats from new entrants.
Conclusion
In conclusion, the SaaS landscape is rapidly changing, influenced by distinct valuation trends across global markets, the growing impact of generative AI, and the relentless focus on revenue growth. U.S. SaaS companies, with their larger domestic markets and stronger tech ecosystems, continue to command higher valuation multiples than their Canadian and European counterparts. This discrepancy creates unique arbitrage opportunities for private equity firms to acquire undervalued companies outside the U.S. and potentially achieve higher returns. Meanwhile, as generative AI becomes a game-changer, SaaS companies must leverage these technologies to strengthen their competitive moats rather than risk losing their edge to new entrants. Understanding these dynamics and adapting accordingly will be crucial for SaaS companies aiming to maintain their market leadership and capitalize on future growth opportunities.
David Friedberg, the All-In Podcast, May 31st 2024