

Defining and Analyzing Cost Per Mille (CPM) across the Media Universe
CPM (Cost Per Thousand Impressions) is crucial for marketers aiming to maximize their ROI. So which entertainment source is the best bang for your buck?

What is a CPM?
A key metric advertisers use to determine their spending on advertisements is known as a CPM, which means cost per thousand impressions. This metric is particularly useful for services like Disney+ and YouTube, where advertisements can be programmed to be make exactly 1,000 impressions, making a CPM a straightforward measure of cost efficiency.
CPM is less applicable, however, to both non-streaming services and traditional linear television. Despite this, I wanted to explore viewership data to calculate the implied CPM for a wide range of sports, streaming services, and other platforms. My goal is to identify which advertisements are the most and least expensive and why.
Why are there discrepancies in CPMs?
Before I go on, I want to first explain why there are discrepancies in CPMs in the first place. These discrepancies can be attributed to differences in the measurement methodologies used by different platforms, differences in ad viewability, and variations in audience targeting.
For instance, one platform might count an ad impression as soon as it is loaded, while another might count it only if the ad is in view for a certain amount of time. Additionally, ad fraud—such as bots generating fake impressions—can inflate CPM rates, leading to inaccurate data.
Additionally, the type of audience and how finite you define your target can impact the CPMs. As we will see with YouTube, if advertisers believe more affluent audiences are watching a certain type of content, they are willing to pay more for ads.
Finally, content quality and inventory availability can affect CPMs. If a service like Disney+ has more quality, household-name content, advertisers recognize that viewers are more likely to engage. More engaged viewers are attributable to higher CPMs, too.
All of these factors combine to cause variation in CPMs among platforms, which we will now observe with streaming services.
Streaming Services
Netflix, Disney+, Peacock, Hulu, Amazon Prime
We’ll start by using data on CPMs for streaming services.
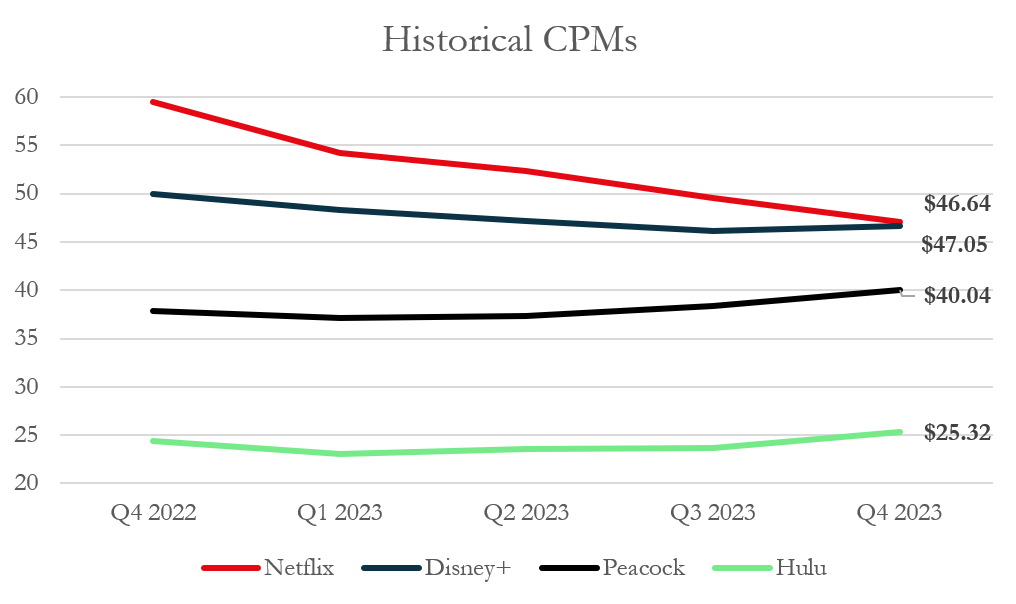
Using data from eMarketer, Netflix and Disney, you can see that both currently sit at the highest CPM of around $47. Peacock trails with a CPM of around $40 and Hulu sits the lowest at around $25.
One noticeable trait from this chart is that the gap between the maximum and minimum CPM has tightened, hovering around $35 in Q4 2022 but now at around $22.
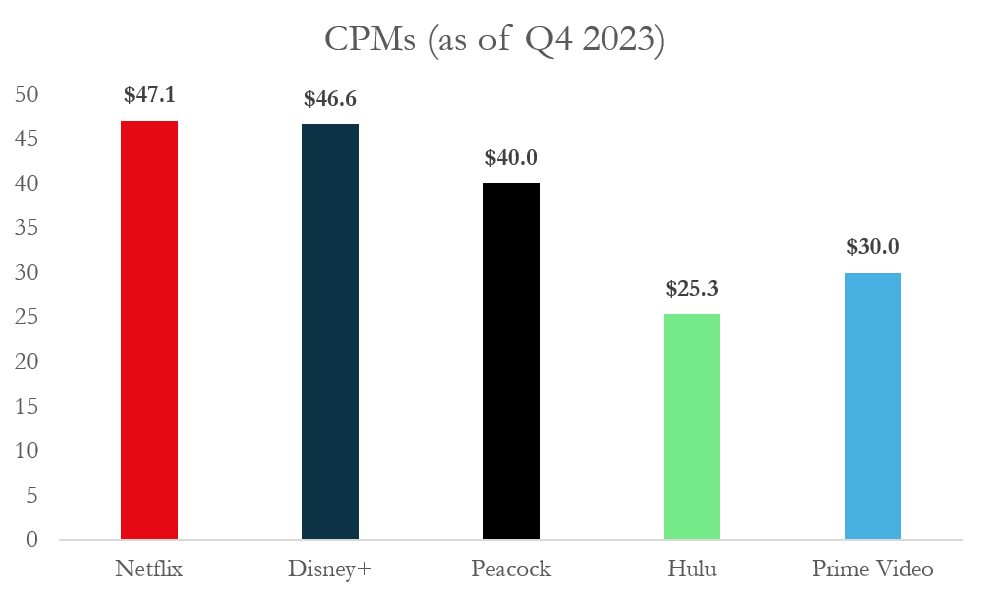
Additionally, Amazon Prime Video disclosed in a pitch deck that it retains CPMs of around $30.00.
Extended Analysis — Streaming Services
There are many reasons why Netflix and Disney+ are clear winners with CPMs, but I would suggest it’s most likely correlated with these main points.
Higher Quality Audiences / Catalog
Netflix and Disney+ tend to attract a more premium audience compared to Hulu and Amazon Prime. This is largely due to Netflix’s catalog of award-winning shows and Disney’s extensive library of Marvel, Star Wars, and Pixar content. In contrast, Hulu and Amazon Prime don’t offer as many high-profile shows. As a result, subscribers of Netflix and Disney tend to be more affluent and willing to pay for high-quality content, leading to greater engagement while consuming content.
Inventory Availability
One of the primary drivers behind high CPMs (Cost Per Mille) for Netflix and Disney+ is the concept of inventory availability. For example Netflix is primarily ad-free. Thus, if they ever do choose to offer advertising opportunities, they can charge a premium (~$47) due to the novelty and exclusivity of the ad space. Disney+ also provides an ad-free experience for most subscribers, which means any ad placements can be priced higher due to their rarity and the primarily disruption-free viewing experience. This scarcity of ad slots creates a high demand from advertisers eager to reach their premium audiences, allowing these platforms to charge significantly higher CPMs. On the other hand, platforms like Hulu and Amazon Prime, which have more frequent ad placements, naturally offer more inventory. While this increases the availability of ad space, it also dilutes the exclusivity, leading to lower CPMs in comparison to Netflix and Disney+.
Market Leadership
Finally, both Netflix and Disney+ are leaders in the streaming market. Their dominant positions allow them to set higher prices for advertising.
Content Sharing Platforms
Now, let’s dive into what I will call “Content Sharing Platforms.” These platforms are still technically streaming platforms, but they are also similar to social media. These platforms include YouTube, Rumble, Kick, Twitch, etc.
These platforms work slightly differently since the wide range of content offered can vary CPMs. Let’s start with YouTube to demonstrate.
YouTube Case Study
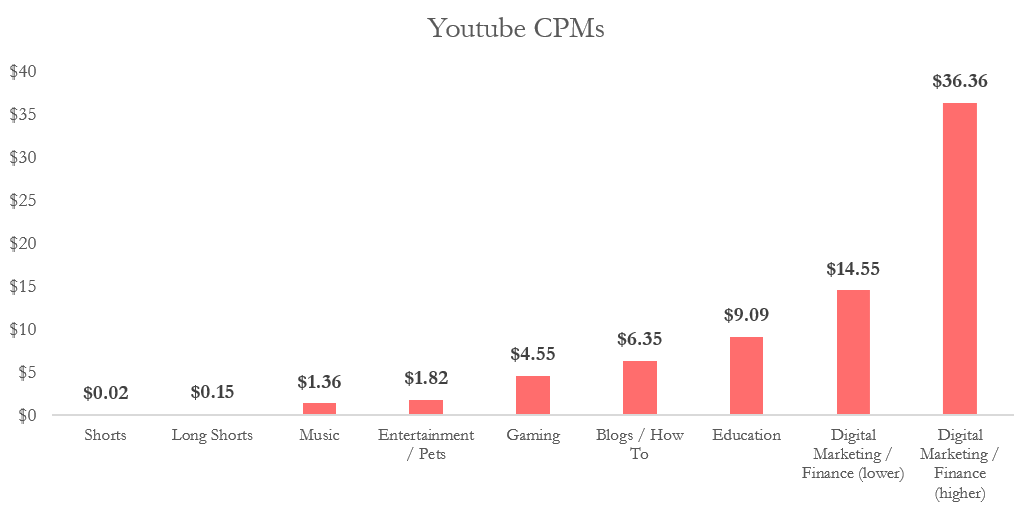
CPMs vary based on the type of content produced by the creator. YouTube charges advertisers $4.55 per thousand views to insert their ad into a gamer’s YouTube video, and 8 times that for an ad in a digital marketing video.
In general, however, average CPMs for most YouTube creators range from around $8-10. As an ex-gaming YouTuber myself, my CPMs hit a high of $4 but mainly lingered around the $2 range.
The variation in CPMs within YouTube is a testament to the importance of audience traits. For instance, a 12-year-old watching their favorite Minecraft YouTuber is much less likely to purchase a product advertised to them, compared to a millennial who works 40 hours a week and is watching a video on how to allocate their savings. This difference in audience behavior and purchasing power significantly influences the CPM rates for different content types.
Content Sharing Platform CPMs
With that being understood, CPMs for each social media platform can be estimated here:
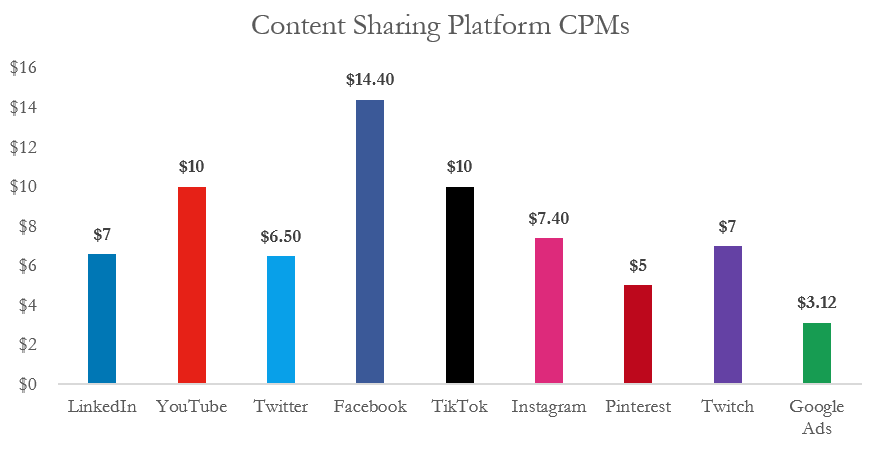
(Quick note: I used an estimate for both YouTube and Twitch’s CPMs based on research I conducted internet-wide, scouring both multiple threads and websites. The rest of the CPM data was confirmed across multiple sources.)
From the graph, it is apparent that Facebook maintains the highest CPMs in the social media business. This makes sense on the surface since Facebook’s user base is much older. As of 2024, 73.1% of Facebook’s users were older than 25 years old. Many of these users maintain purchasing power.
TikTok and YouTube both boast impressive average CPMs of around $10. As discussed earlier, YouTube’s vast user base allows it to command high CPMs from advertisers. TikTok, however, is a surprising contender. Typically, short-form content attracts lower CPMs due to users' quick swipes and diminishing attention spans. Despite this, TikTok has one of the highest CPMs in the industry. This success can be attributed to TikTok's extensive data on each user, enabling it to deliver highly targeted ads. Thus, both platforms, with their vast user bases and rich data on user preferences, can charge advertisers $10 per thousand views.
Extended Analysis — Content-Sharing Platforms
I want to share a couple of other graphs to compare with the CPMs above. The first offers the average click-through rates (CTRs) on every platform.
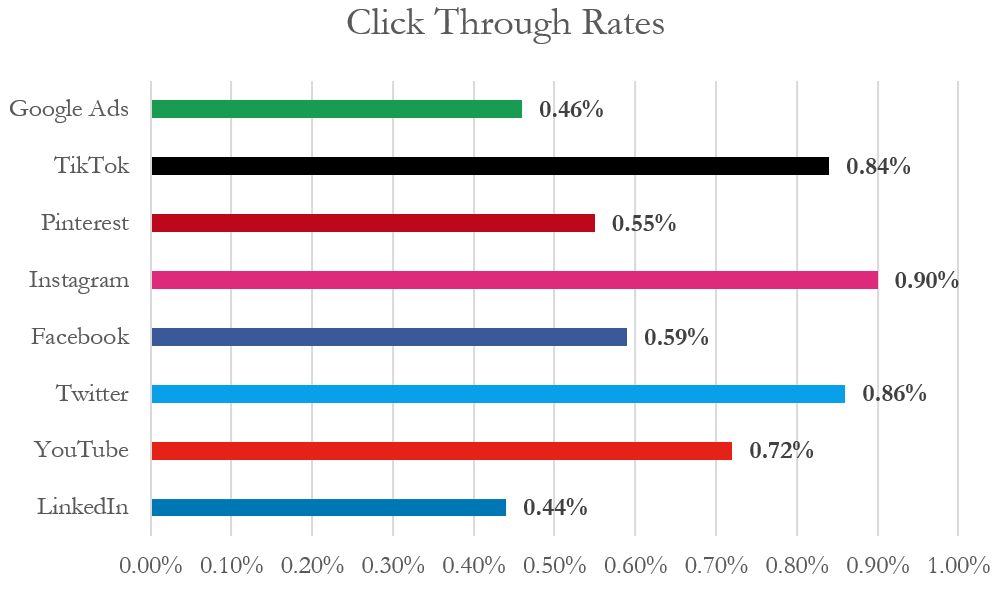
Observably, Instagram, Twitter, and TikTok retain very high average CTRs on their ad programs. This is impressive, as Twitter and Instagram have cheaper CPMs. Facebook’s CTR of only around 0.6% is lackluster considering its high average CPM of $14.40.
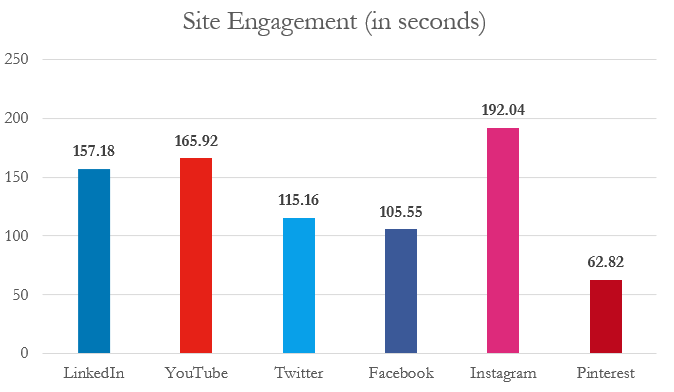
Another graph to consider is one that was created by YOTPO, an e-commerce marketing platform.
(Relevant data on TikTok, Twitch, or Google Ads not immediately available)
This graph tracks the average amount of seconds spent on an advertiser’s website by a user who has clicked on an ad. Instagram and YouTube are group leaders in terms of site engagement, with Pinterest badly lagging.
To look at all this data at once, I correlated CTR with engagement rates to see if higher CTR was associated with higher engagement.
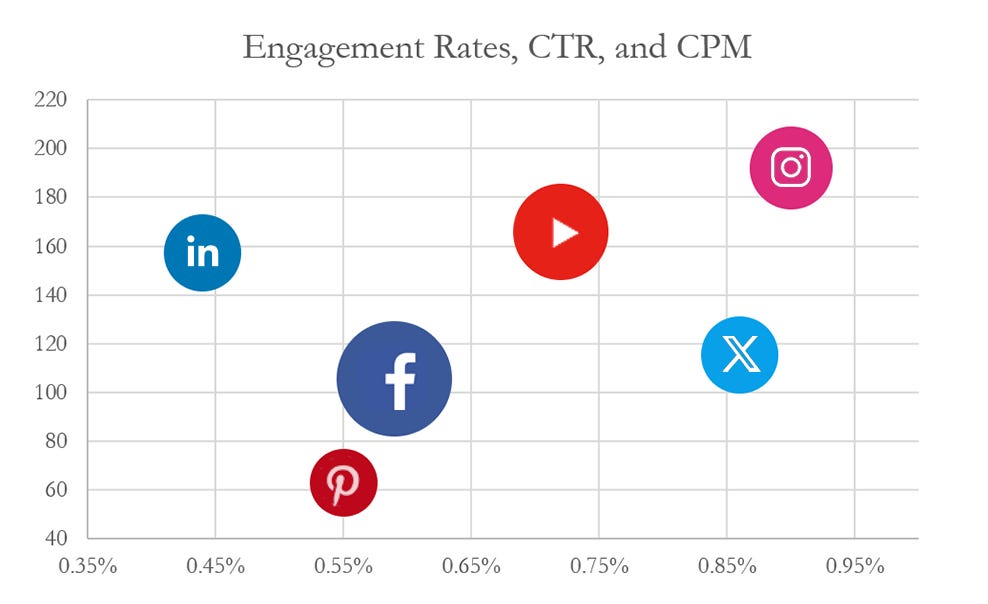
Additionally, the size of the bubbles represents the CPM of the platform.
One would think that the graph would be positively correlated, with the largest bubbles being in the top right (reasoning: services with the highest CTRs and Engagement Rates would charge the highest CPMs for their ads). While a positive correlation is suggested by a correlation coefficient of r = 0.3938, the most expensive platform (Facebook) is not the one with the highest CTR or engagement rate. Instead, it is the one with the second-worst CTR and engagement rate.
This graph suggests that Instagram ads may impart the biggest bang for your buck. Instagram retains a CTR of 0.9%, average engagement rates of 192 seconds, and a mere $7 CPM.
Linear Television & Sports
Moving on, linear television (meaning traditional broadcast and cable TV) operates differently from streaming and content-sharing platforms regarding advertising. While digital platforms can offer highly targeted and measurable ad campaigns, linear TV ads reach a broader audience and often command high CPMs due to prime-time spots and live events, especially sports. Linear television CPMs traditionally runs from $25-65.
What is Broadcast v. Cable?
Broadcast networks are networks that are subject to stricter regulations and provide free access to anyone with an antenna (ABC, CBS, Fox, NBC), whereas cable networks are networks that deliver content through cables and can be accessed via cable service providers, targeting niche audiences with specialized and premium content while facing fewer content restrictions. These networks will require a subscription to be purchased. Examples include AMC, USA, TNT, Freeform, and HBO.
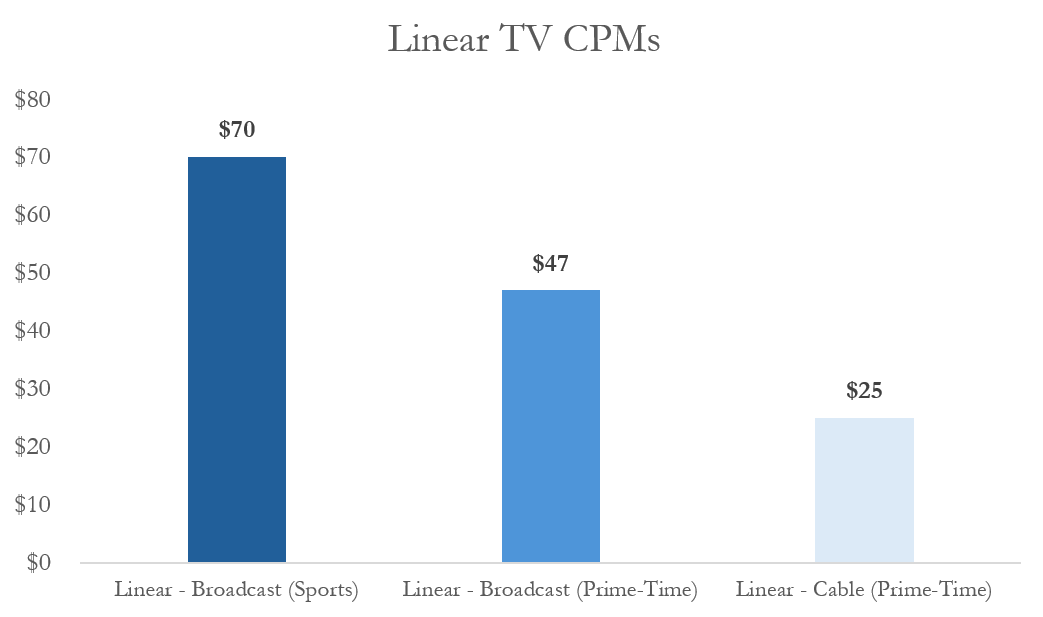
Why do CPMs differ between Broadcast and Cable?
As visible from the graph, Prime-Time Cable has CPMs at half that of Broadcast. The largest reason for this is due to audience sizes. Broadcast networks are much larger than cable networks, and reach much broader audiences. In contrast, cable is often used to reach smaller, more specific audiences. Broadcast's large reach, therefore, commands higher CPMs.
Sports
Sports command the highest CPMs among all types of programming mentioned in this article. The primary reason is that sports attract highly engaged audiences who are more likely to watch live and pay attention to advertisements. This live viewership minimizes the chances of ad-skipping, ensuring that ads are seen by viewers in real time. Additionally, sporting events are often deeply embedded in tradition, with commercial breaks and sponsorships becoming a key part of the viewing experience.
Also, advertisers benefit from the broad demographics that sports events attract, which include many affluent viewers who are likely to spend on sports products.
This is exhibited by a study in 2021 that found that advertising revenue per viewer/hour was $2.95 for the NFL regular season, compared to that of Broadcast primetime of $2.46, with Facebook, Instagram, and YouTube all around $0.50.
Extended Analysis - The NFL and the Super Bowl
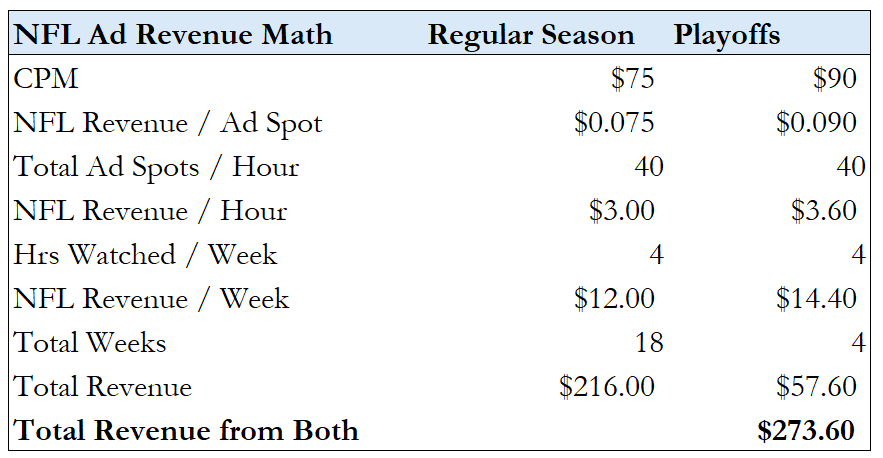
The NFL is the most valuable and famous sports league in the United States, with a 2021 study by Standard Media Index finding that Ad CPMs during the NFL regular season and playoffs sit at an average of $75 and $92, respectively.
Using the $75 CPM, we can work backward to calculate just how profitable ads are for the NFL on a per-person basis.
If for every hour of NFL time there are 20 minutes of ads, then there are 40 thirty-second spots per hour. An advertiser pays the NFL $0.075 per impression (75/1000) for the spots. This translates to $3.00 in advertising revenue per hour (basically what is shown above.)
If an average NFL fan watches 4 hours of NFL per week, that means the person generates the NFL $12.00 in ad revenue per week. The NFL has a regular season of 18 weeks, allowing us to conclude that in the regular season, the NFL generates around $216 per fan from ads alone. Adding four more weeks of playoffs at a $90 CPM, we get to $3.60 in advertising revenue per hour, $14.40 per week, and $57.60 total. Thus, we get to a total of $273.60 per person in ad revenue to the NFL per year.
That’s separate from NFL Sunday Ticket and NFL Redzone as well. Stunningly, the revenue generated from ads per NFL viewer is more than a year’s worth of ad-free Netflix, Disney+, YouTube Premium, and Prime Video. Wow.
So What’s the Best?
So what’s an advertiser to do? Put yourself in their shoes for a minute. Let’s say you have $1M in advertising budget to spend with a 30-second ad ready to send out. Based on that budget, here are six different options. You could:
Reach 10.87M NFL viewers
Reach 21.28M Primetime Broadcast viewers
Reach 21.74M Disney+ viewers
Reach 39.49M Hulu Viewers
Make 100M YouTube or Tiktok Impressions
Make 140M Instagram Impressions
What’s the best? The truth is it depends on your company, but what’s best might involve a conglomeration of all of these options. If I had to pick just one, however, I would tend to favor YouTube, as YouTube has recently disclosed that around 40% of its viewership comes from TVs. In general, one who sits down at a TV to consume content is more likely to pay attention to the advertisement.
Because of this, YouTube may begin to generate a Return-on-Ad-Spend (ROAS) similar to that of traditional broadcast TV while maintaining lower CPMs due to YouTube’s “streaming” classification.
Conclusion
In summary, CPM is a vital metric in advertising, measuring the cost to reach a thousand viewers. As digital streaming and content-sharing platforms rise, CPM's importance grows, revealing how the platform, audience quality, ad viewability, and content type cause discrepancies.
Streaming services like Netflix and Disney+ have higher CPMs due to premium content and large audiences. Content-sharing platforms like YouTube and TikTok show CPM variation based on audience and content type, highlighting their targeting capabilities. Traditional linear TV, especially live sports, commands high CPMs for its broad reach and engaged viewers, with the NFL as a prime example.
Marketers must balance factors like audience reach, engagement, content quality, and platform traits. Understanding CPM trends helps advertisers optimize spending and social platforms’ project revenue. Understanding CPM is crucial for advertisers and platforms alike, as it enables them to maximize return on investment (ROI) and optimize their strategies for better outcomes.
Sources:
S&P Global, Solomon Partners, Cross Screen Media, Reddit, Centralcasting.com, eMarketer, Gupta Media, WebFx, YOTPO, TubeBuddy